How to Peform SAP HANA MONITORING
SAP HANA MONITORING
In this guide,I explain different Hana Monitoring Checks that we need to perform in daily health check of SAP Hana System.
Before that please Raad : What is SAP HANA system and SAP ABAP System Monitoring
Once you have the understanding of SAP HANA System and Normal SAP ABAP system Monitoring then you can perform below SAP HANA MONITORING CHECK.
Open SAP HANA STUDIO >> CLICK ON SYSTEM CONNECTION –>It’ll connect Hana Studio to that SAP system
SAP HANA MONITORING CHECK |
HOW TO PERFORM CHECK |
| Check #1 > System availability
|
Landscape–>Services–> tab. |
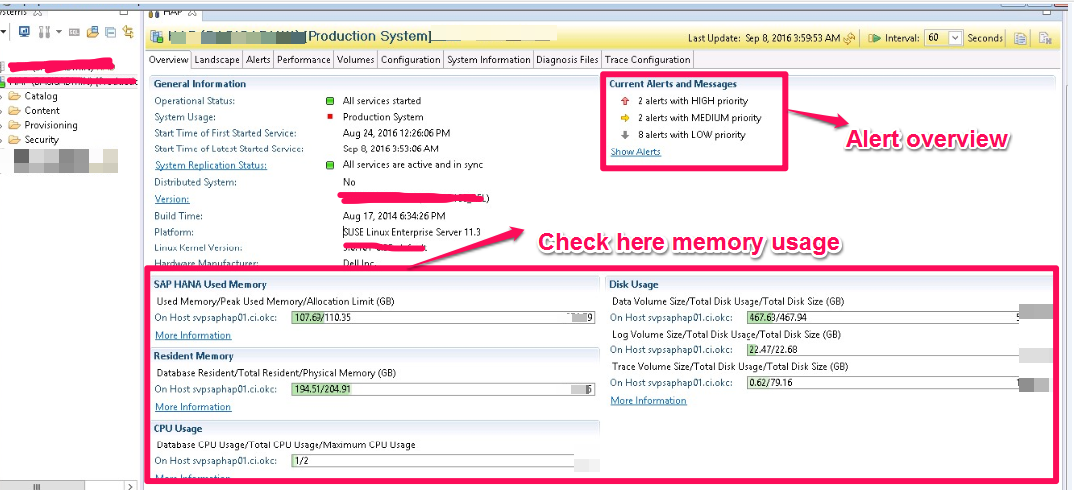
| You can verify the operational status of all your SAP HANA systems at a glance in the System Monitor and of individual systems on the Overview tab of the Administration editor. For full system availability, the following services must be active for each system: 1)nameserver 2)indexserver 3)preprocessor
|
| Check 2 > New and past alerts
SAP HANA self-monitors its own status and performance and alerts you of critical situations (that is, when defined threshold values are reached or exceeded). |
Overview tab of the Administration editor in SAP HANA Studio |
| Check 3 > Database Used Memory–> Used Memory | |
| The total amount of memory currently in use by SAP HANA is referred to as its used memory. | |
| Check 4 > Database Used Memory–> Peak Used Memory | |
| The Used Memory value is a current measurement. The Peak Used Memoryvalue is the highest used memory value recorded. This is useful for keeping track of the maximum value for used memory over time.
|
|
| Check 5 > Check Resident Memory | |
| Resident memory is the amount of physical memory that is actually being used from the perspective of the operating system. | |
| Check 6 > CPU Usage | |
| The information displayed here indicates the percentage of CPU used by the SAP HANA system compared with the operating system as a whole. | |
| Check 7 > Disk Usage | |
| The information displayed here indicates disk space occupied by data, log, and trace files belonging to the SAP HANA system compared with the operating system as a whole.
|
Please refer below screenshot for reference:
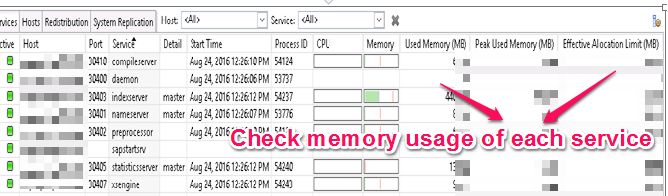
| Check # 8 >Current memory usage of individual service | Landscape–>Services–>tab of the Administration editor
|
Refer below screenshot:
| Check # 9 >Regular, successful execution of backups | System Information tab |
| You can access the backup catalog, which provides information about the execution and history of data and log backups |
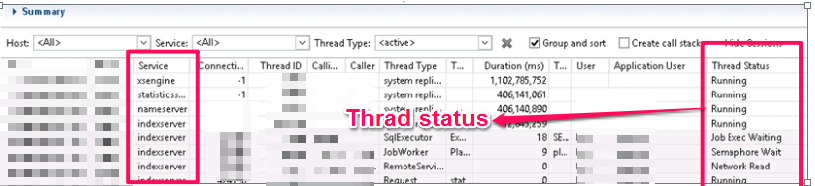
| Check # 9 >Number of active threads and the duration of the top 5 threads | Performance–>Threads
|
| Here you can analyze the following: 1)Expensive SQL statements) 3)Sessions 4)SQL performance history 5)Progress of long-running operations 6)System load history
|
Please Read : How to Start and STOP SAP HANA
Thanks for sharing info on How to Peform SAP HANA MONITORING
I like reading it
Keep us updated with such information
Hi… The blogs are really helpful & I request you to add about licensing for SAP s4hana.
nice information. | Certification | Cyber Security Online Training Course|
Ethical Hacking Training Course in Chennai | Certification | Ethical Hacking Online Training Course|
CCNA Training Course in Chennai | Certification | CCNA Online Training Course|
RPA Robotic Process Automation Training Course in Chennai | Certification | RPA Training Course Chennai|
SEO Training in Chennai | Certification | SEO Online Training Course